酒場放浪記で紹介された居酒屋のGoogle口コミ点数をで可視化してみた
/ 1 min read
Table of Contents
はじめに
酒場放浪記が好きなので、plotly の練習も兼ねて Google の口コミ点数を可視化してみました。
どちらかというと取り込むデータを作るほうが大変でしたが今回そこは省略して、可視化のところだけ。
点数的には 4 点台を中心に集まっている感じですね。やはりいいお店が多いんでしょう。
内容
ヒストグラム
fig = px.histogram(df, x='rating', histnorm='probability density')fig.show()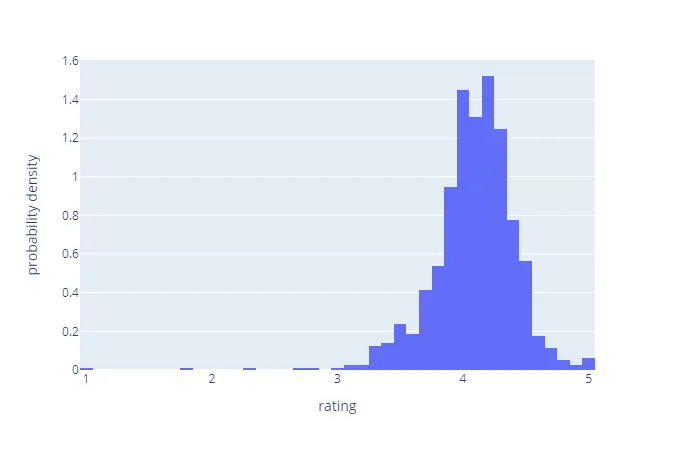
ヒートマップ
fig = px.density_mapbox( df, lat='latitude', lon='longtitude', z='rating', radius=10, mapbox_style='stamen-terrain')fig.update_layout(mapbox_style='open-street-map')fig.update_layout(margin=dict(b=0, t=0, l=0, r=0))fig.show()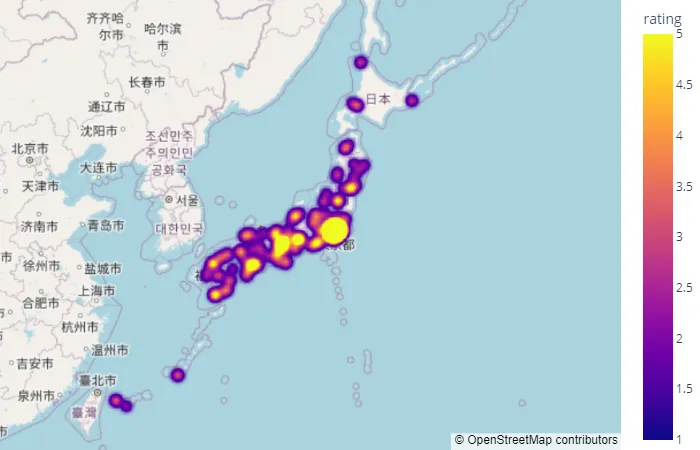
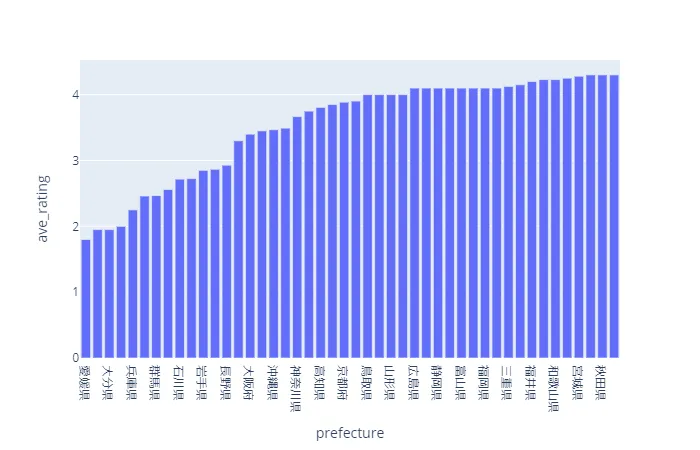
バーチャート
都道府県別の平均点を昇順で並べてみました。
import plotly.express as px
fig = px.bar(    df_pref,    x='prefecture',    y='ave\_rating').show()